Welcome to the Energy Twin (ET) extension for SkySpark. Energy Twin is a machine learning-based SkySpark extension for energy data analysis and prediction.
Energy Twin libraries available on StackHub:
- ET Analytics
- advanced ML library using detailed models with up to 15min sampling
- ideal for building electrical energy consumption analysis and prediction
- anomaly detection - predefined Sparks
- tailored KPIs
- based on the TOWT model by LBNL
- free to download, licensed by ET Core
- ET Interactive
- simple to use regression analysis using degree-days models and ASHRAE change point models
- interactive model tuning and outlier removal
- perfect for heat consumption analysis
- free to download, licensed by ET Core
- ET Core
- core mathematical modeling algorithms referenced by both ET Analytics and ET Interactive
- ET licensing mechanism for both ET Analytics and ET Interactive
- ET Evaluation
- additional tool for ET models’ prediction evaluation
- free to download, operates only with models from ET Analytics and ET Interactive
- ET Common Tools
- necessary package containing common functions used by all extensions
See the ET website for case studies and more information: Energy Twin webpage.
ET Licensing
- ET license is valid for both ET Analytics and ET Interactive
- ET license is defined by two parameters:
- expiration date
- the maximum number of models that can be defined at one time (see the explanation of a model below)
- the maximal number of models is calculated across all projects on the SkySpark server
- the sum of the models that are defined in ET Analytics and ET Interactive is evaluated
- What is a model?
- ET counts models in a similar way to SkySpark license points
- each model is linked to one point
- typically a kW point of a meter
- one model usually equals one meter
- model can be re-linked to any other point and re-trained anytime
- Ask ET sales (-----------------------------) for an individual offer or start with one of the two predefined starter licenses
- Starter 6 x 12
- use up to 6 models for 12 months
- Starter 72 x 1
- use up to 72 models for 1 month
Introduction
Regression models such as change point and degree days models are widely used for predicting energy consumption based on outdoor temperature. These methods are used in M&V projects and in general for any energy consumption evaluation where one needs to suppress varying outdoor temperature.
Energy Twin (ET) Interactive is a SkySpark extension for energy evaluation using regression models without need for exporting data to other programs to avoid tedious and potentially erroneous data transfer. With interactive GUI, you can focus on data and its interpretation instead of lengthy manual data processing. ET Interactive will make our energy analysis work more efficient.
Interactive GUI
Get results in real-time as well as identify outliers easily with the ET Interactive graphical data representation. Exclude any data points and modify the model for better results based on metrics such as R2, CV(RMSE), or model shape validation. You can change the aggregation period to monthly, weekly, daily, and most importantly, daily with the weekend setback. Change points are also adjustable – tune your model and instantly observe the changes in statistical properties of the model.
Machine learning
Sometimes, you do not want to tune all parameters on your own, and for such a case, ET Interactive provides automated model parameters selection tools. Selecting the optimal change point or automatically determining the model type and the change point is the option. ET Interactive will try hundreds of possibilities, including all model type possibilities and their change point variations, and select the best model using multiple criteria.
Supported models
Model type
- Change point models
- Two Parameter Model
- Three Parameter Heating Model
- Three Parameter Cooling Model
- Four Parameter Model
- Five Parameter Model
- Degree days models
- Heating Degree Day Model
- Cooling Degree Day Model
- Heating & Cooling Degree Day Model
Model periods
- Daily
- including a separate model for weekend setback
- Weekly
- Monthly
Technical details
- M&V adherence
- Evaluation of model statistical properties according to M&V requirements
- Open API
- Integration of prediction into your applications
- Smooth SkySpark integration
- Prediction point provides prediction in all standard SkySpark applications
- Easy to use user interface
- On the edge
- ET Interactive uses just standard SkySpark libraries - no external packages are used
- All computations are done on the SkySpark server - no data sharing nor sending to the cloud
Manual
Energy Twin Interactive
Welcome to the Energy Twin Interactive manual. Energy Twin Interactive is a versatile SkySpark extension for building energy baseline modeling. The baseline model can be used to predict energy use and determine energy savings, and the identification of operational problems.
There are Administration, Model Definition, Modeled vs. Measured, and Manual tabs in the Energy Twin Interactive (ETi) toolbar.
Administration
The administration tab contains a complete list of created models with their aggregation period, model type, span, and value of statistical properties like CV(RMSE).
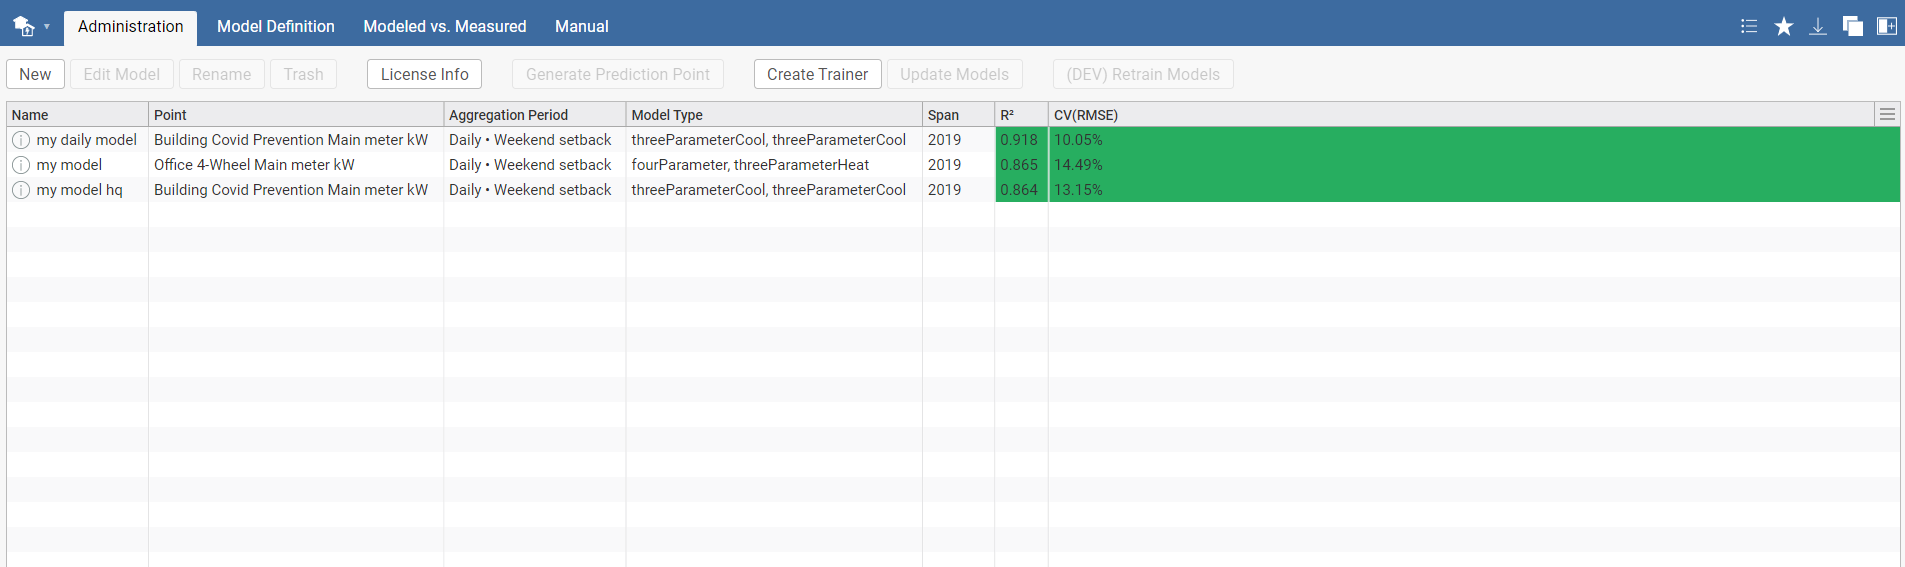
You can edit any already existing model or generate a prediction point. For creating a new model, click on New, and you will be automatically redirected to the Model Definition tab.
Model Definition
In the Model Definition tab, you can create a new model or edit previous models.
In order to create a valid model, you have to select point you want to model and the kind of the dependent variable accordingly:
- Power - if point represents kW interval data (e.g. average kW in 15 minute interval)
- Energy - if point represents kWh interval data or meter reading in kWh (cumulated value )
- Energy Per Period - if point represents kWh per billing period or total kWh per regular period (e.g. daily kWh)
- Max Power Per Period - if point represents maximal kW per billing period or maximal kW per regular period
Note: ETi isn't limited to just kW and kWh points, one can also model gas and water consumption. It is important to differentiate between cumulative and actual values (e.g., m3 vs m3/hour).
After selecting training period (span), select model's aggregation:
- Sum - total energy per selected period vs. average temperature
- Avg. Daily Sum - average daily energy consumption vs. average temperature
- Max - maximal power vs. maximal daily average temperature over the selected period
There are 5 options for model's aggregation period:
- Daily No setback - interval data or daily meter readings
- Daily Weekend setback - interval data or daily meter readings
- Daily Schedule - interval data or daily meter readings, needs a schedule point set up.
- Weekly - interval data or weekly meter readings
- Monthly - interval data or monthly meter readings
- Define by tariffHis - billing periods defined by the tariffHis point
In case you are not sure which setting to set - the guide can be displayed by clicking on the Help button.
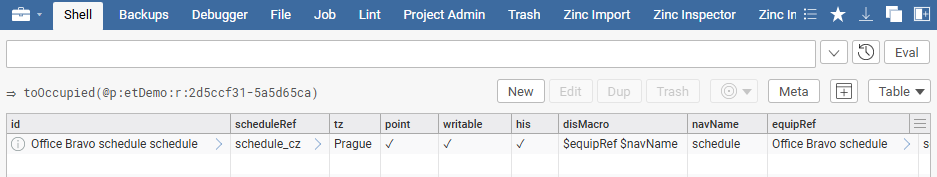
To check if you have correctly set up the schedule point when using Daily Schedule, run the toOccupied(@dataPointId) in the Shell. In case you don't see the schedule please refer to the official documentation of toOccupied().
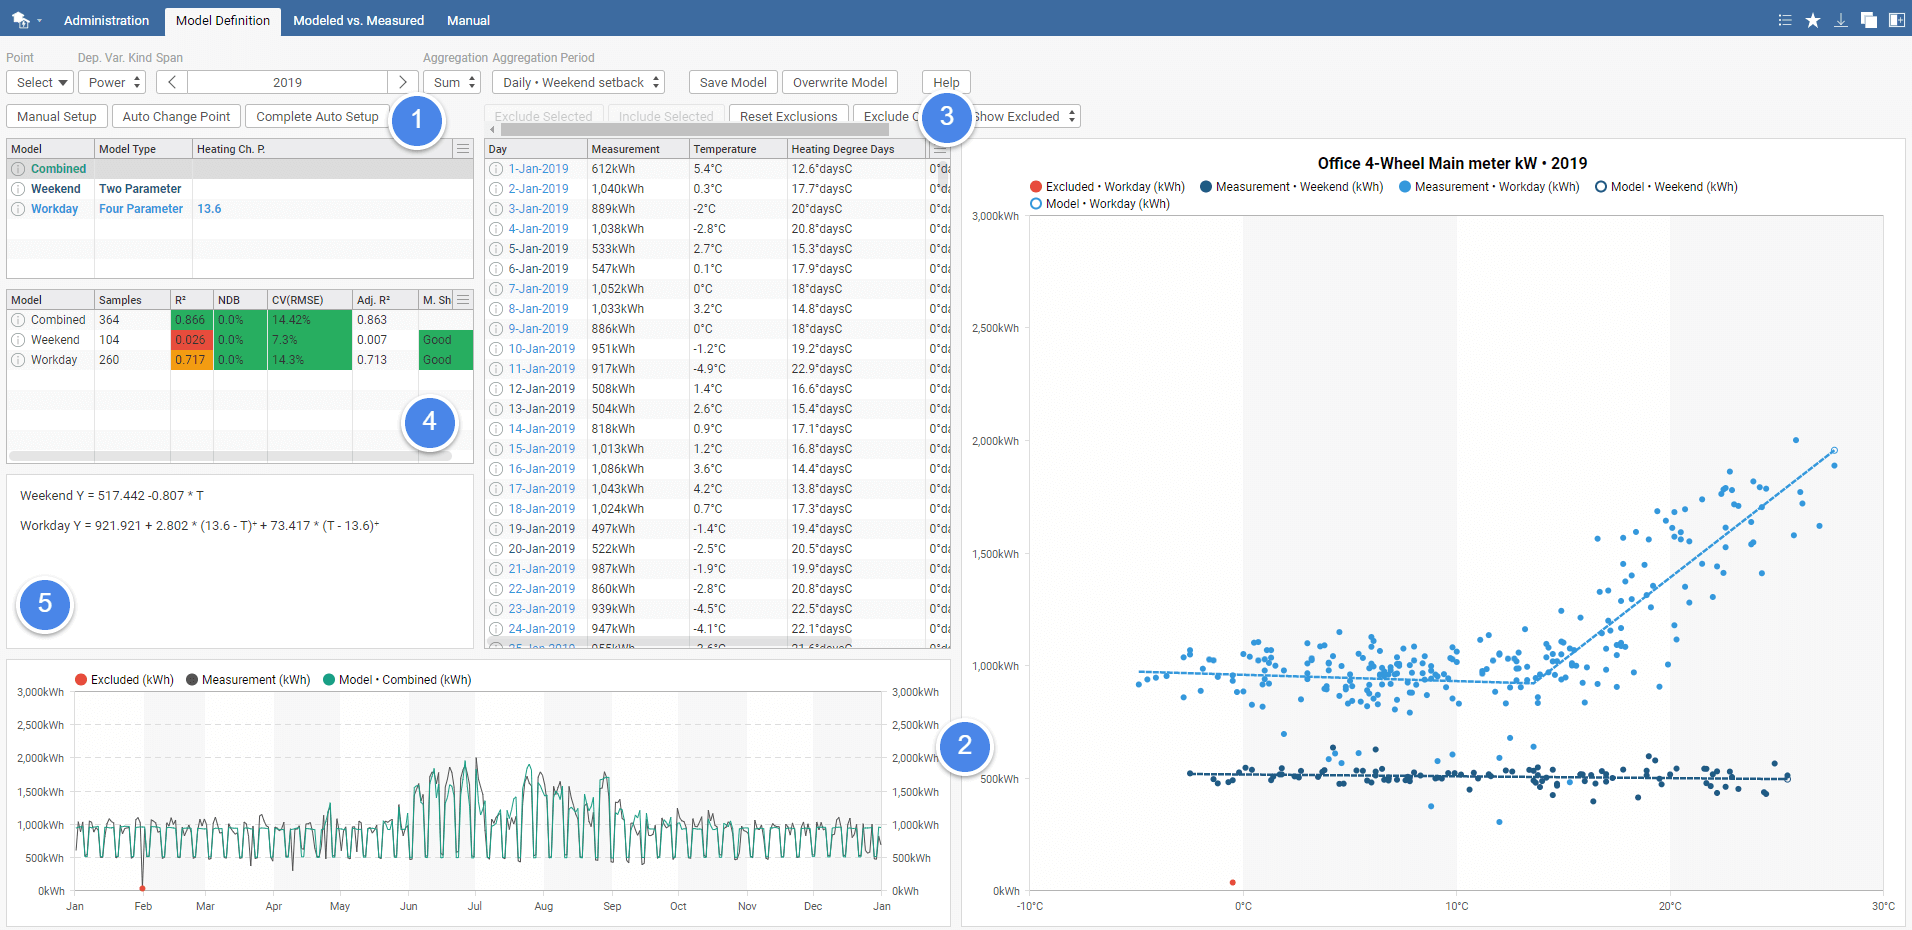
Once you specify needed inputs, it is time to play around in ETi.
- Set up the models - choose from Manual Setup, Auto Change Point, and Complete Auto Setup, for more details see chapter Model & model parameters selection.
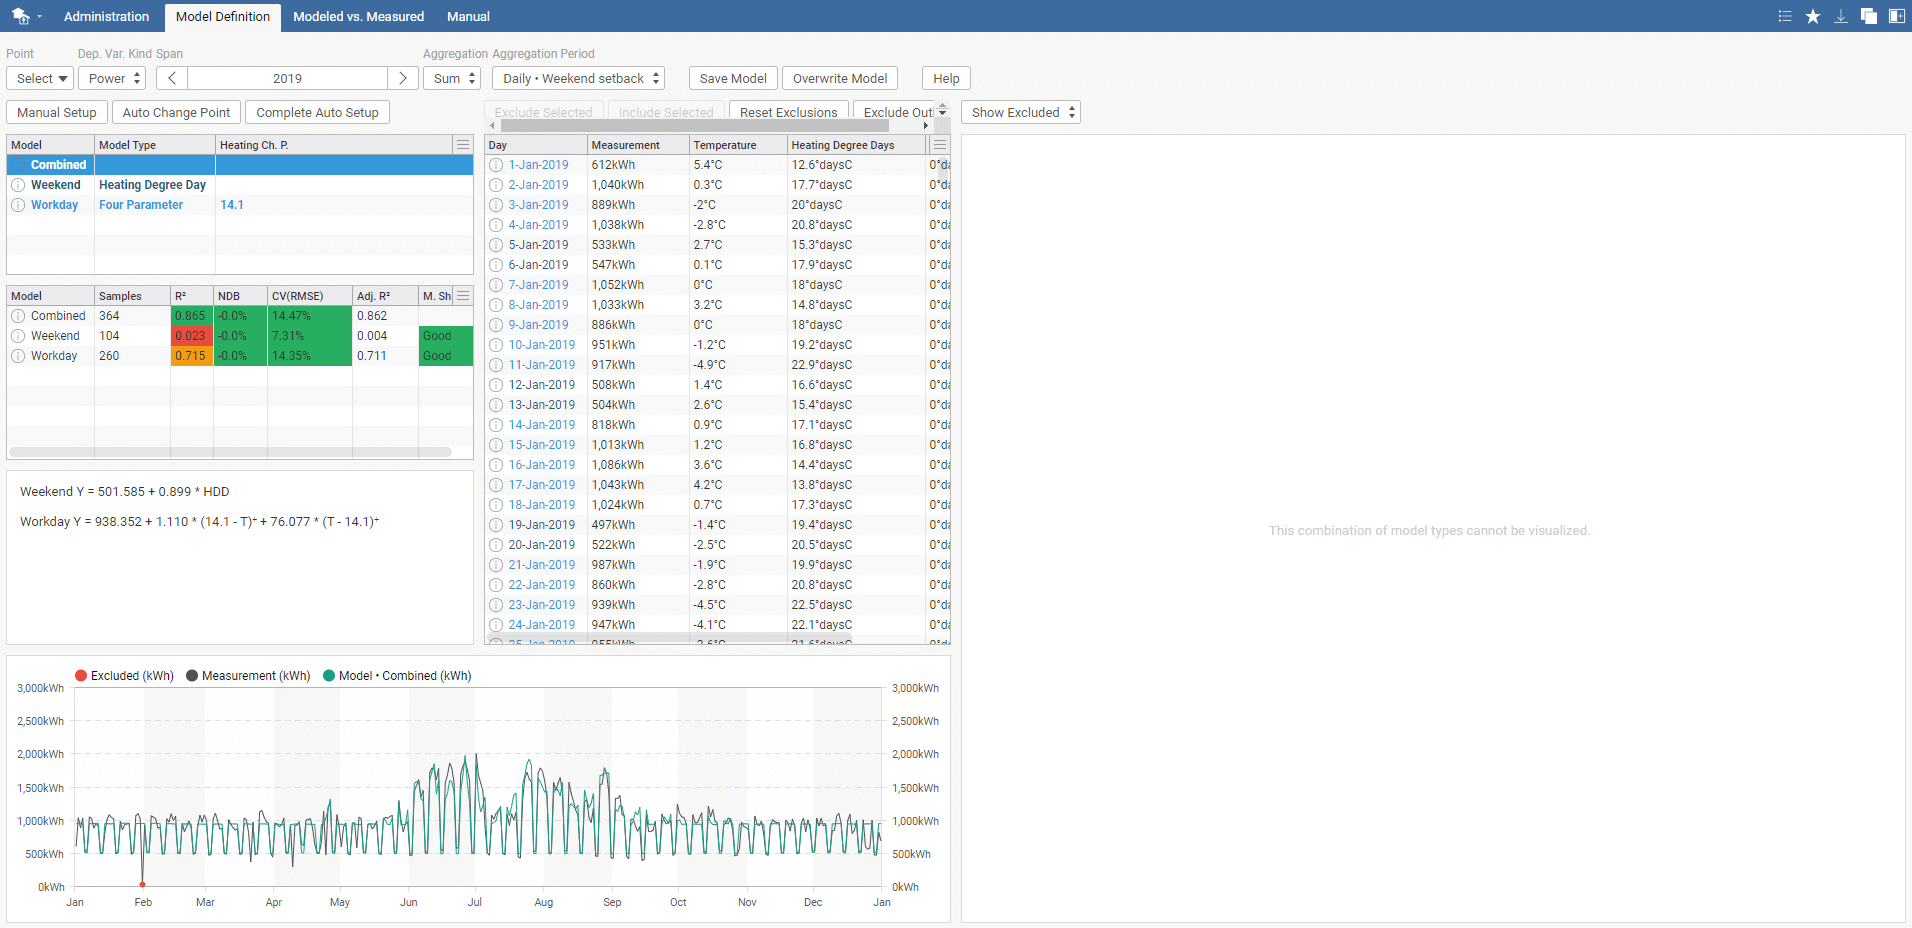
- Visualization - efficiently identify outliers with real-time graphical data visualization. Check the model overview, measurement, excluded data, etc. See the data fit clearly for weekdays and the weekend immediately after applying changes to the model.
- Outliers - exclude ( Exclude selected ) or include ( Include selected ) various data points. For easier manual outlier detection sort by measurement. Using the key ctrl select multiple outliers and exclude them at once. Visualisation can be adjusted to either show or hide excluded points. There is an option for automatic outlier Exclude Outliers of outliers further than 3 standard deviations.
- Statistical properties - various metrics, such as R2, RMSE, and NDB can be found in the overview chart for the combined, workday, and weekend model.Green color indicates acceptable values according to M&V guidelines, whereas orange is borderline value and red color indicates bad model.
- Equations - equations characterizing the currently displayed model.
A model can be edited without the need to create a new one each time. Also, after tuning the model, you can rewrite it or save it as a new model instead.
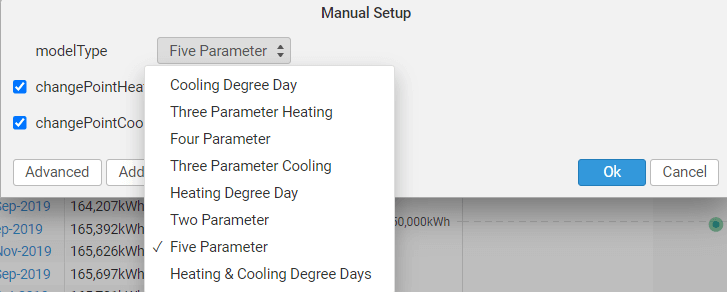
- Manual Setup = a pop-up window will appear where you can select the model type to the following: Cooling Degree Day, Heating Degree Day, Heating & Cooling Degree Day, Five Parameter, Three Parameter Heating, Three Parameter Cooling, Four Parameter, or Two Parameter according to your requirements. You can also manually set the change heating point and cooling point.
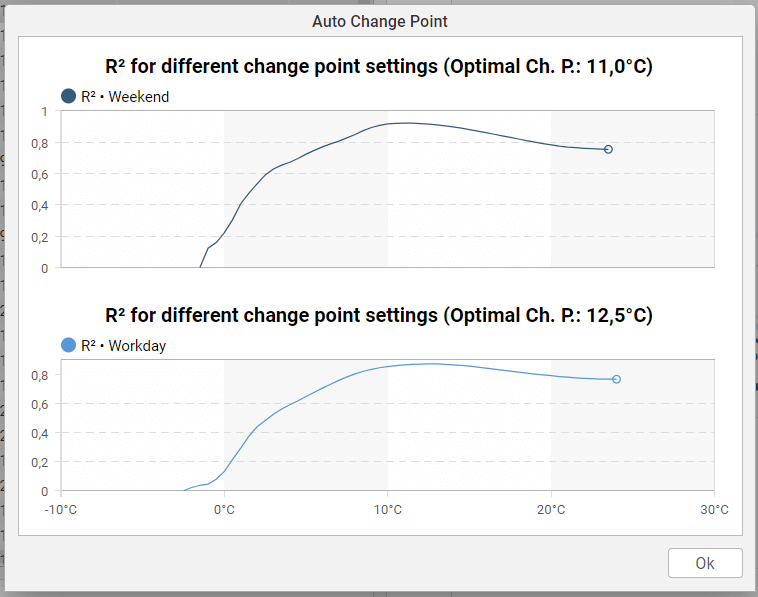
- Auto Change Point = find the most appropriate change point automatically, which is determined by the value of R2 metrics. The higher, the better. As you can see the change point can vary between the weekend and workday model.
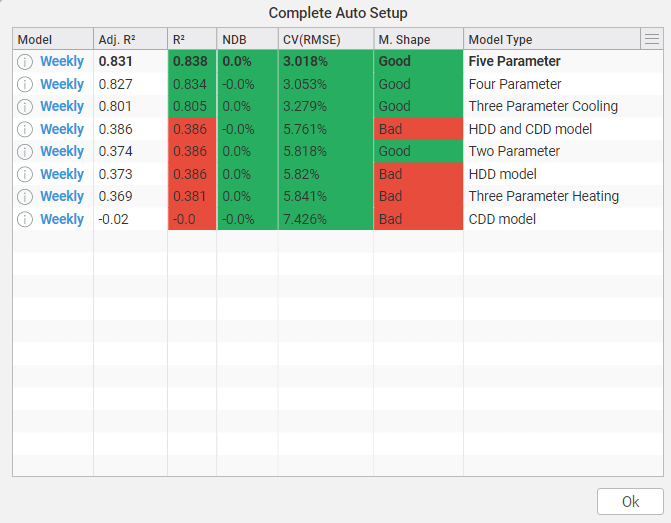
- Complete Auto Setup = a pop-up window with a review of all possible model types and their result will appear. Models are sorted by adjusted R2. The model with acceptable shape and highest adjusted R2 is selected. Note that optimal change-points are also calculated in this process. Unfortunately you cannot configurate your model by clicking on the pop-up window. If you want to choose different model than the best one according to the Complete Auto Setup you have to go through Manual Setup.
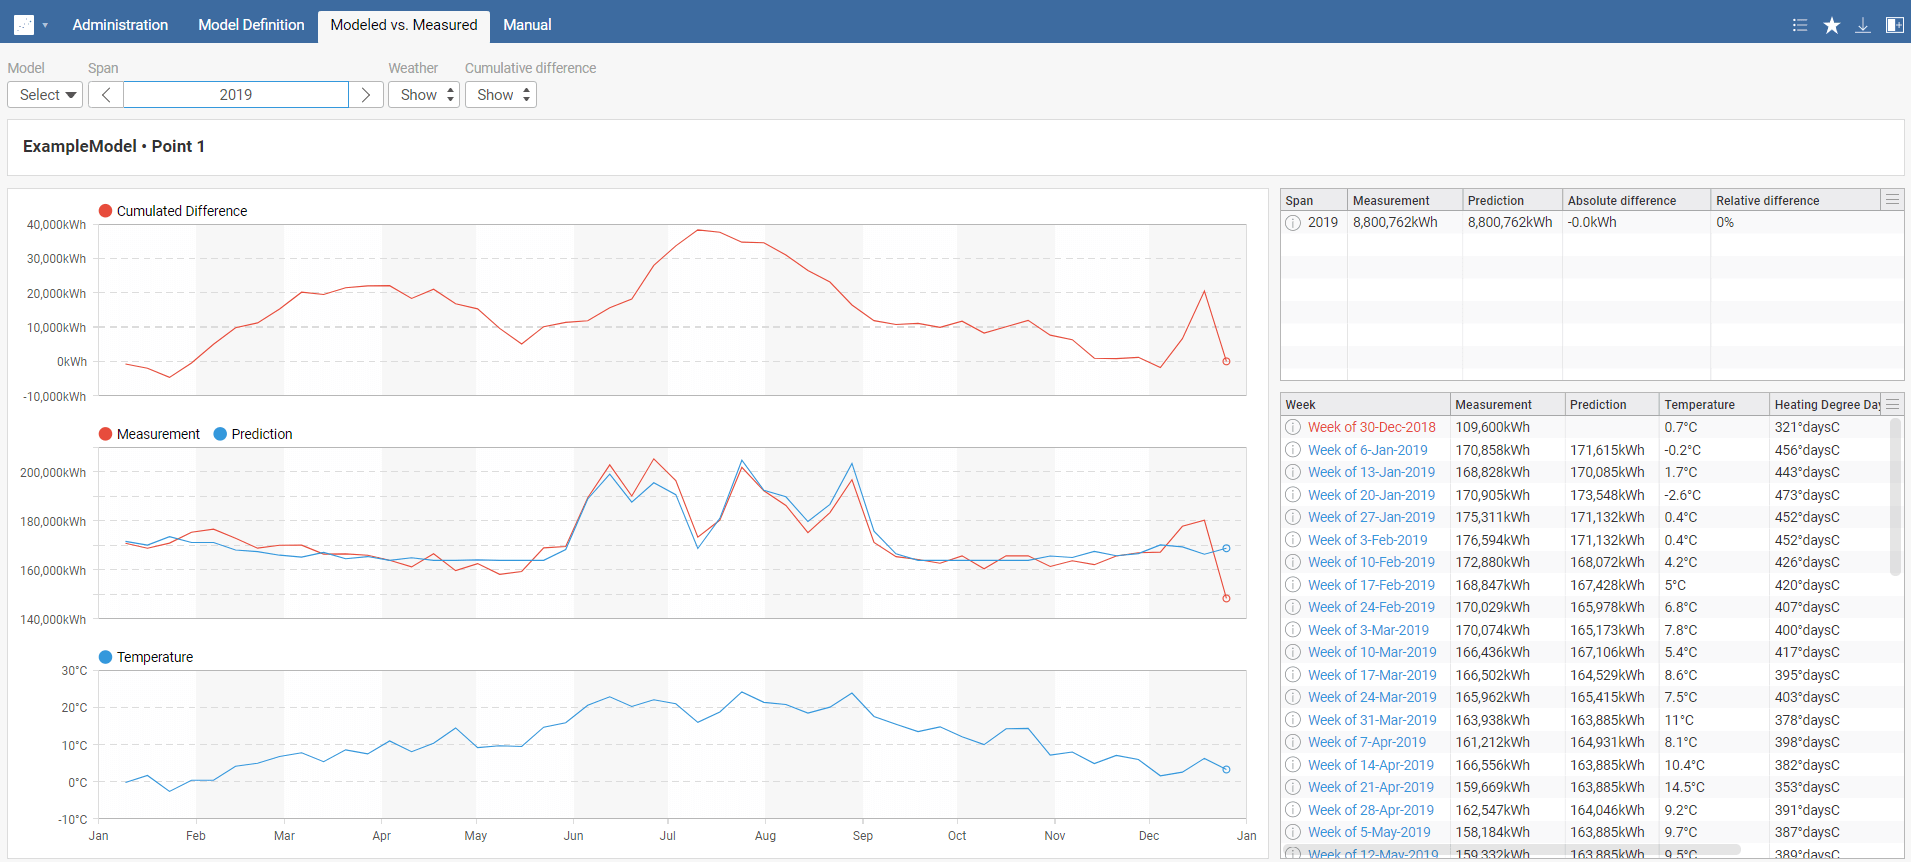
Modeled vs. Measured
In this section, you can generate an overview for models of your choice for any time span. Consequently, you can choose to either show or hide the Weather and Cumulative difference in the taskbar. Note that Cumulative difference isn't available for Max and Avg. Daily Sum aggregations. The upper table shows a review of selected models, their measured energy consumption, predicted consumption, and the difference and relative difference. Underneath there is a graph showing the measured and predicted energy consumption and graphs showing the weather and cumulative difference depending on your settings.
Troubleshooting
If any errors occur check common mistakes:
- Select model(s) - the view will not work unless you select a model.
- In case of selecting aggregation to daily with a weekend setback, there will be three models: Combined, Weekend, and Workday. For the Combined model, use Complete Auto Setup only.
- Visualization is not possible if one model is a parameter model and the other is a degree day model since the resulting graphs have different quantities represented by the x-axis.
Model doesn't correspond to real data
If your model doesn't correspond to your data try the following:
- Check time span, dependent variable king, aggregation and aggregation period, and validity of your data.
- Exclude outliers in the GUI.
- Check model type and change points - try using automatic tuning feature.
- Disclaimer: In case of HDD/CDD, it depends on the settings of SkySpark's function degreeDays.
API Functions
API Functions are Axon functions that are available for users. Only a brief description will be provided, for more information see StackHub Axon Funcs tab
etiModelPredict(model, span)
This function calculates a prediction of the given model.
Example: etiModelPredict(read(etiModel), 2019-01)
etiPointIdentifyOptimal(point, span, aggregation, aggregationPeriod, subModelName, modelType)
This function returns R2 table for all changepoints.
Parameters
- point
- span
- aggregation
- options: etiFoldDiff, etiFoldIntegral
- etiFoldDiff: difference between first and last value in rollup period
- etiFoldIntegral: integrated sum in rollup period
- depVarKind
- aggregationPeriod
- used to rollup data
- options: 1day, 1wk, 1mo
- subModelName
- used to filter data
- options: "base", "weekend", "workday"
- "base": no filtering
- "weekend": only weekend data
- "workday": only workday data
- modelType
- options: "twoParameter", "threeParameterCool", "threeParameterHeat", "fourParameter", "fiveParameter", "hdd", "cdd", "hddCdd"
Example: etiPointIdentifyOptimal(read(point), 2019, etiFoldDiff, 1day, "weekend", "hddCdd")