For all your Heat Map needs!
Carpet Shop provides tools for visual heat map (carpet plot) analysis of HVAC and energy data. Gain valuable insight into your data within a few clicks:
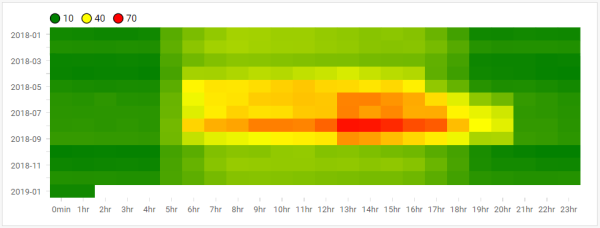
This chart of power consumption in an office building clearly shows:
- Consumption is increased during summer months (May - Sep) This is cooling - this is okay!
- Consumption is increased after office hours (5 – 8 pm) - Cooling scheduling failure!
Learn more at: